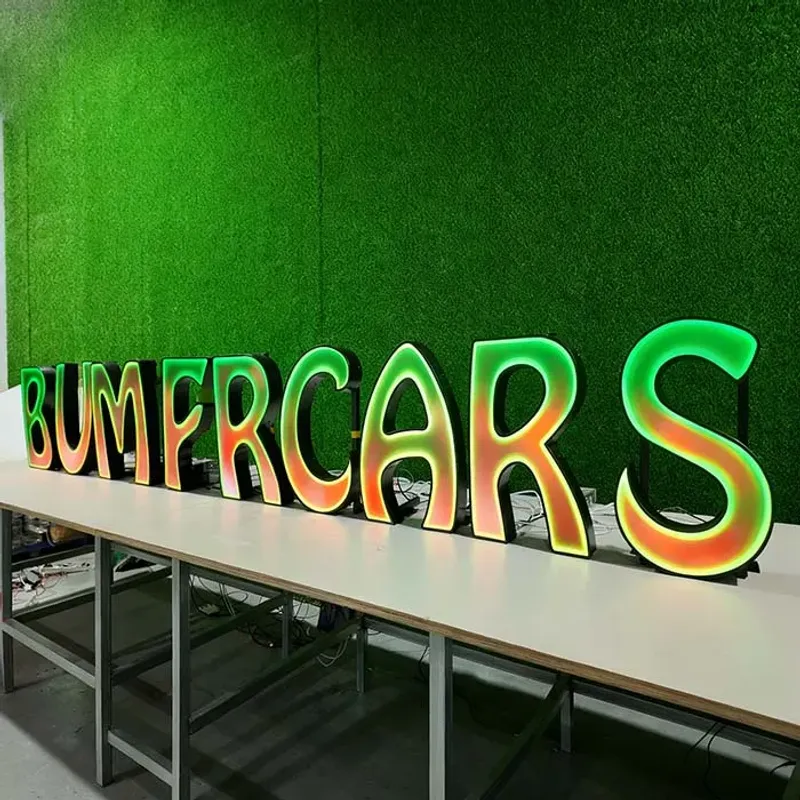
I've spent 16 years building signs, not selling spreadsheets. But when a customer asks me "how much revenue will this sign bring in?", they're asking the wrong question. And most ROI guides online are written by people who've never lifted a channel letter.
Let's get this straight right now: a sign doesn't generate revenue. A sign generates attention. Revenue happens when that attention meets a good product, a clean storefront, and a door that actually opens. But if you want numbers, I'll give you numbers — real ones from factory pricing, UL certifications, and worldwide of shipping experience. You'll find honest ROI math here, plus the hard truth about what manufacturers promise and what we actually deliver.
The ugly truth is that most ROI calculators are bullshit. They start with a baseline of "average sales per square foot" and then ask you to assume your sign will increase foot traffic by 30%. Where does 30% come from? Nobody knows. It's a marketing number, not an engineering one.
Here's what I've seen go wrong: a restaurant owner pays $14,000 for a backlit sign with fancy trim, expects to recoup it in three months, and blames the sign when sales don't move. But their store is on a side street with zero parking, and the sign faces north behind a tree. A $300 LED light box would have done the same job. Don't shop for a sign based on a percentage. Shop based on visibility physics and cost per impression.
So let's replace fake calculators with a simple framework. It won't win a business school prize, but it's how buyers actually think.
Start with cost per visible hour. That's the only number that matters.
If you buy a factory-direct front-lit channel letter set for a 8-foot storefront, you're paying maybe $1,200–$1,500 for the product, plus freight and installation. Let's say $2,500 all-in. If those letters run 12 hours a day at 200W total, you're burning about 2.4 kWh per day. At $0.12/kWh, that's $0.29/day in electricity. Over 5 years, that's ~$530 in power. Total cost of ownership: $3,030.
Now, how many eyeballs does that sign catch per day? In a typical suburban retail strip with 20,000 cars passing daily, a reasonably visible sign catches maybe 2–5% of drivers. That's 400–1,000 impressions per day. Over 5 years, that's 730,000 to 1.8 million impressions. Divide $3,030 by that. You're paying $0.002 to $0.004 per impression. If just one out of every 5,000 impressions walks in and spends $30, you've made $4,380–$10,950 against a $3,030 cost. That's the real ROI math.
See what I did? I used realistic conversion numbers, not fantasy. Most customers won't convert. But a good sign is cheap attention. And attention, unlike rent, is reusable.
Here's a brutal question: how many extra customers per month does your sign need to pay for itself? Work that out before you call a factory. If your sign costs $2,500 installed and your average ticket is $40, you need 62.5 additional paying customers over the sign's life to break even. That's roughly one customer every two weeks over 3 years. Any decent sign can do that if people can physically see it.
Now, what if your average ticket is $400, like an HVAC contractor or law firm? You need just 7–8 new clients over 3 years. That's a much easier pitch. That's why professional services buy premium stainless steel letters: at $30–$80 per letter from our factory, one retained corporate client pays for the whole sign.
But if you're a coffee stand with a $6 average order, your math changes. You need thousands of extra transactions. For you, a cheap, bright acrylic light box makes more sense than an over-engineered halo-lit masterpiece. Don't let a salesperson convince you otherwise.
Let me give you actual costs. These are not retail prices. These are what sign shops and importers pay when they order direct from my factory in Lu'an, Anhui.
Here's the catch: those prices assume you know what you're buying. If you don't specify LED quality, you'll get cheap modules that die in 18 months. I've seen it happen to importers who ordered by price alone.
I'm going to tell you something most factories won't. We can't guarantee your sign's ROI. Nobody can. Anyone who promises "this sign will increase sales by X%" is lying or guessing. What we can do is guarantee the materials, the light transmittance, and the lifespan.
Here's what I mean. If we use Mitsubishi or Degussa acrylic with 90–92% light transmittance and UV resistance, that face will last 5–8 years before yellowing. If we use domestic acrylic, it may yellow in 1–2 years. Same sign shape, same look on day one — but drastically different ROI over 5 years. We'll tell you exactly which we're using. You decide how long you need the sign to work.
And LED modules? A quality module using Samsung or Osram chips will hit L70 after 50,000 hours — that's about 11 years at 12 hours per day. Cheap modules from a no-name factory will dim to 70% in 12–18 months. The price difference is maybe $1–$2 per meter. If you're calculating ROI across a 5-year ownership period, that difference is the entire game.
Stop reading and open a spreadsheet. Here's your formula.
Now compare that to your total installed cost, divided across 60 months (a 5-year ownership). If your extra revenue is at least 2x your monthly cost, the sign is worth it. That's your break-even multiplier.
Here's a real example. I have a client in Ontario who bought a dual-lit channel letter sign from us for a dental clinic. Product cost $1,800, shipping $400, local electrician $600. Total $2,800. The clinic saw 15,000 cars per day on a main road. Visibility factor 35%. Monthly impressions: 15,000 × 0.35 × 30 = 157,500. Conversion: 0.7% — because dental customers are often already searching. That's 1,102 new visits per month. Even at $1,500 average treatment value, just 1% of those presenting became patients: 11 new patients per month, ¥?? Sorry, I mean $16,500 extra monthly revenue. Against a $46/month amortized sign cost. That's a 358x return. Not typical, but that's what good placement and a visible sign can do in a service industry.
Rookie mistake number one: forgetting about electricity, maintenance, and permits. A halo-lit sign uses roughly 20–30W per letter. Ten letters = 250–300W. At 12 hours a day, that's $120–$180 annually in power. Permits run $100–$500 in most jurisdictions. Maintenance — cleaning and gasket replacement — about $150–$300 every 2 years. Add those in, or your "profitable" sign becomes a negative line item.
Rookie mistake number two: buying the cheapest sign you can find because you're only looking at the PO. I've seen $60 LED modules fail in a year. Replacing that means a lift rental, an electrician, and a shut-down day for your business. That's $1,000 of labor to fix a $60 part. If you're importing, this is even worse — you can't just call for warranty when your sign is in Ohio and your supplier is in Anhui. We handle warranty claims by shipping replacement modules, but you're still paying local labor. So calculate lifetime cost, not product price.
A sign's ROI is locked to its location. Here's the breakdown I give every importer who asks me for advice.
Here's what nobody tells you about LED quality: the color temperature is just as important as brightness. 3000–3500K warm white makes a restaurant or spa look inviting. 4000–5000K neutral looks clean for retail and corporate. 6000–6500K cool white is for industrial and highway signs. If you pick the wrong color, your sign looks "off" — and customers won't tell you why they don't walk in. They just don't.
But the real ROI is in the LED chip itself. Cheap 2835 modules may be 80 lm/W. Quality Samsung or Osram modules hit 100–150 lm/W. That's fewer modules needed, lower power draw, and 5+ year actual life. If your sign runs 3,650 hours a year, the difference between a 12W module and a 6W module is about 22 kWh per sign per year. Not enormous. But the difference between replacing modules at 18 months and 4 years is enormous in labor cost.
We use quality modules as standard — either Samsung, Osram, or Lanjing (Blueview), the Chinese brand that actually meets spec. If you want something cheaper, we'll sell it to you, but we'll tell you it's going to have a shorter life. I'm not in the business of lying to importers who'll come back and haunt me when their sign dies mid-winter.
You're reading this because you're comparing options. You're a sign shop owner thinking about ordering from a factory, or a business buyer trying to skip the middleman. Good. Here's the honest tradeoff.
Factory-direct saves you 50–65% on product cost. But you pay for shipping (express 7–15 days, air 10–20 days at $4–12/kg, or sea 50–70 days at $80–200/m³ LCL). You also need to know US Section 301 tariffs add roughly 30% on certain sign products. And if you want UL listing, that's a $4,000–$15,000 cost and 4–9 months of testing. Many importers skip UL and use ETL, which is 10–30% cheaper. But your local inspector still has to accept it.
There's a reason we ship worldwide and have CE, RoHS, and ISO 9001 certifications. That doesn't mean we're perfect. It means we've been audited. Ask any factory for their certificates with today's date on them. Most won't show you. We will, because we've got nothing to hide.
A sign's revenue generation isn't just about the sign itself. It's about how you use it. Let me give you four practical moves that have worked for my customers.
Stop obsessing over "how much revenue a sign generates." The number is unknowable in isolation. What you can know is the cost of attention. A good sign gives you impressions for pennies. A bad sign gives you none. The difference is material quality, visibility, and maintenance.
Here's my offer. Send me your dimensions, your location, and your average ticket. I'll give you a factory quote within 24 hours, and I'll also tell you whether you're overspending or underspending for your situation. That's not a sales pitch. That's what 16 years on the floor does to a person. We've built signs worldwide, and we've seen what works and what gets ignored. If I think a simple acrylic light box is the right call instead of a $4,000 halo-lit job, I'll tell you.
We have a minimum order of one piece. Lead time is 7–15 days. Warranty is 2 years on LEDs, 1 year on power supplies. And we'll be here in five years when your modules still work — because that's the only way you'll come back with the next project. That's the real ROI: a supplier who doesn't make you pay twice for the same mistake.
Factory-direct since 2010. Free quote within 24 hours — no obligation.
Get a Free Quote → Copy EmailMOQ: 1 piece · Flexible lead time · 2-year warranty · Worldwide shipping
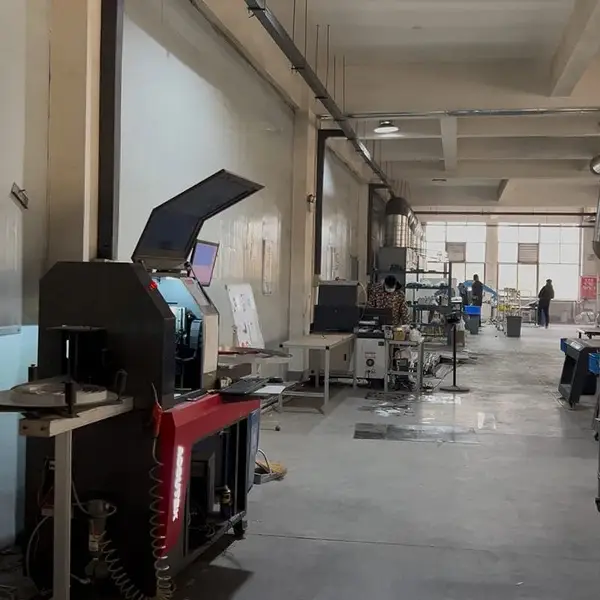
Real photo from our production floor — every sign we ship is made here.
See pricing, specs, and get a free quote for the sign type you need. Built in our factory, shipped worldwide.